Wrike is a Trusted Seller: What that means for your buying journey
For the second year in a row, Wrike has been verified as a TrustRadius Trusted Seller.
News
10 min read
Why Wrike made G2’s Top 50 PLM and ERP software lists
Discover why users ranked Wrike alongside core ERP and PLM systems in G2’s 2026 Best Software Awards — and how a central work management layer connects tools, teams, and workflows.
Maximize efficiency with Wrike’s new agent builder
Create, deploy, and manage AI agents tailored to your processes.
How Wrike MCP Server connects AI agents to real-time work data
Wrike CPO Alexey Korotich reveals how the Wrike MCP Server connects top AI tools like Microsoft Copilot, Claude, and ChatGPT to real-time work management.
Try Wrike Free for 14 Days!
Improve your team's collaboration, enhance work visibility, and so much more.
News
5 min read
Welcome to our new Community platform, featuring Wrike Stars
Explore the new Wrike Community hub with access to Wrike Stars, peer solutions, and templates — all in one place.
News
5 min read
Wrike agents: No-code AI for supercharged productivity
Discover Wrike agents — build, deploy, and manage out-of-the-box and custom AI agents in minutes.
News
10 min read
Video: Wrike’s top 10 product releases of 2025
Explore our top highlights of 2025, including transformative AI tools, powerful customization features, and our all-new Wrike Whiteboard.
News
7 min read
Wrike AI: Our freshest features and newest innovations
Discover how Wrike is making work flow with AI. Stay in the loop with our latest AI capabilities, developments, and updates — all in one place.
News
7 min read
Wrike 2025: Our year in review
2025 was a big year for Wrikers! From our Klaxoon acquisition to our AI product innovations, here’s a look at the highlights we shared together.
News
5 min read
Once a Wriker, always a Wriker: Cory Sevigny’s full-circle journey at Wrike
We love a career boomerang! Read all about Cory Sevigny’s inspiring return to Wrike in our “Once a Wriker, always a Wriker” series.
News
5 min read
Wrike news: Bewitching new features for October
Discover Wrike’s October product updates, including a powerful AI agent builder, seamless Klaxoon integrations, new board templates, and more — dive in to see our latest news!
News
3 min read
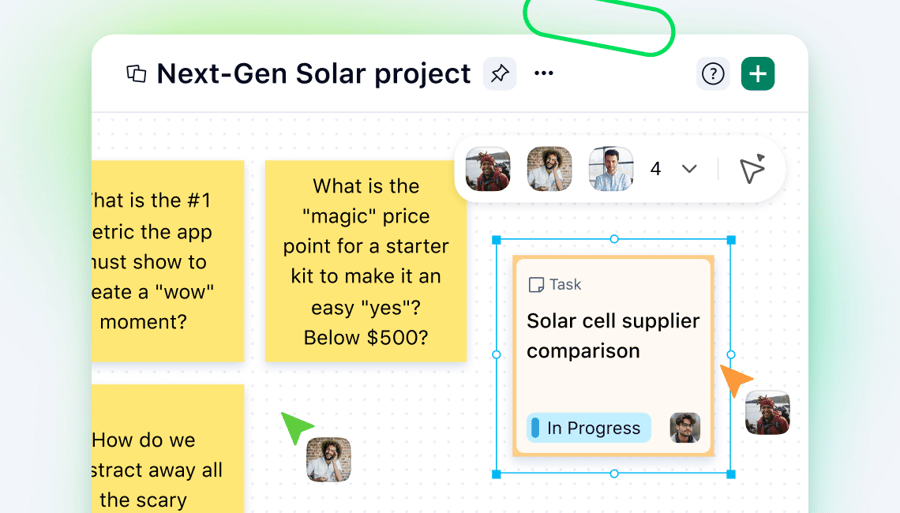
Go visual with Wrike Whiteboard
Introducing Wrike Whiteboard, which offers visual collaboration tools like brainstorming, diagramming, and live polls so that you can connect seamlessly with onsite and remote teams.
News
7 min read
Wrike admin essentials: Keeping your workspace clean and efficient
Discover the latest Wrike updates related to account optimization and admin experience for enterprise companies.
News
7 min read
The best of Collaborate 2025: A recap
Discover the top highlights from Collaborate 2025, including revealing research, exciting product launches, fascinating customer success stories, and more.
News
7 min read
From spark to scale: Our platform vision, delivered at Wrike Collaborate 2025
Read Alexey Korotich’s recap of his Collaborate 2025 keynote, featuring Wrike Whiteboard, Copilot, agent builder, and AI-powered workflow solutions.
News
3 min read
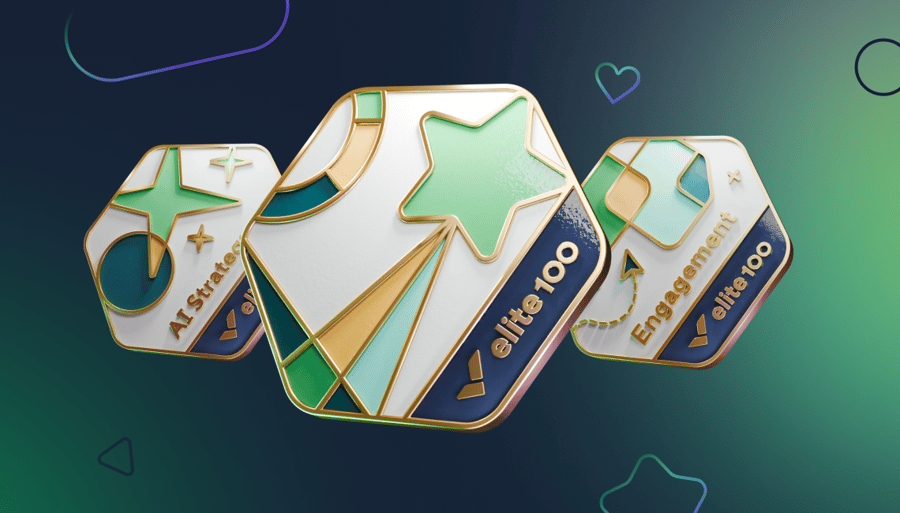
Announcing the Wrike Elite 100 winners
Celebrate our second annual Wrike Elite 100 winners! Discover top achievements in AI, analytics, collaboration, and more. Join Collaborate to learn their winning strategies.
News
7 min read
Make work flow: Register for Collaborate 2025!
Just one week to go until Collaborate 2025, our eighth annual work management conference! Take a peek at our agenda and register today for access.
News
7 min read
Wrike news: New features to fall for this September
Discover all the latest Wrike news, including our freshest features, latest AI developments, and mobile improvements.
News
7 min read
Once a Wriker, always a Wriker: Hau Huynh’s career boomerang story
Read all about Hau Huynh’s journey at Wrike, including his early experiences as Account Manager and what made him decide to return.
News
5 min read
Wrike news: Awesome updates for August
Check out this month’s Wrike news, with a detailed roundup of all our latest updates, improvements, and releases.
News
5 min read
Wrike news: Summer blockbusters for July
Dive into this latest edition of Wrike news, with a stellar lineup of fresh features, new updates, and innovative improvements.
News
7 min read
Wrike news: Sizzling summer releases for June
Take a break from the sun and catch up on all our Wrike news, from game-changing AI to mobile updates and exciting new visual collaboration features.
News
5 min read
Wrike builds buyer confidence to earn TrustRadius Top Rated Award
We’ve hit top marks with TrustRadius in 14 categories and have earned Trusted Seller status! Learn more about these awards and about our ethical review process.